The Data visualiser shows your product coming in from source, through to our master data and then details of all of the partner data which is exported and published.
First to get to the Data Visualiser, go to the Data Tab and then choose Data Visualiser
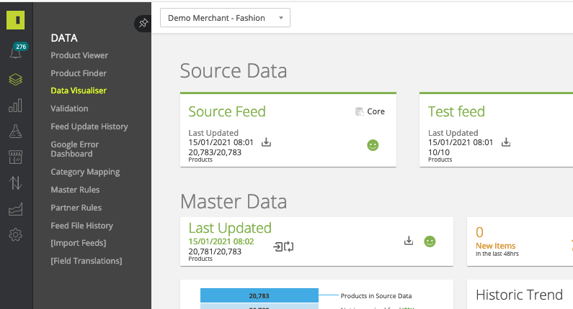
The Data visualiser has 3 key sections to allow you to see all of the data at the 3 levels or points of the process.
- Source Data - that's your data or anything we set up from 3rd party platforms, your ecommerce system, a PIM, an ERP or a scrape of your website. You can see when these sources were last pulled into the platform and if the data is fresh as well as numbers of products in each. You can also manage your schedule for when and how often your data updates.
- Master Data - this is the combined, optimised set of data that is core to your account on the IR platform. We effectively standardise as much of the data (both columns and attribute values) as possible here ensuring it can be quickly transformed into data for any partner requirements.
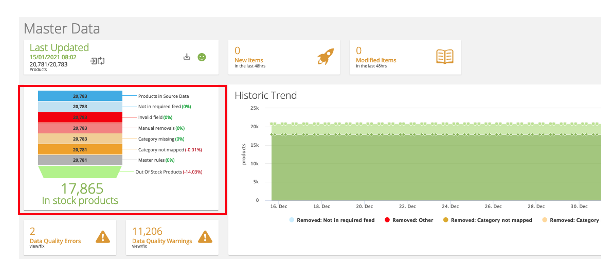
- You can quickly see how many products are coming into the platform from your source data, and identify any products that are not being ingested and more importantly why.
- You also get an indication of products which have low data quality warnings. Click on any of the areas to see if there is a fix for the issue.
- See if new or updated products have appeared in the last 48 hours to ensure you source data is actually updating
- Partner Data - this section shows all of the active partners you have set up on the platform, when they last updated, number of products being exported, any low data quality warnings and the freshness icon so you know the very latest data is going out to partners.
TIP: You can search for any feed using the search at the top right of the Data Visualiser
Sorting the view on the Data Visualiser
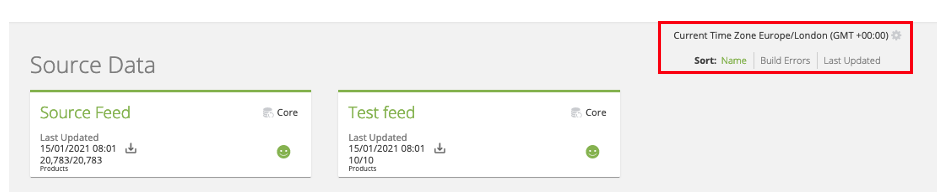
By default your source and partner feeds are displayed by Name (A-Z) but you can click to change this to Show you those with build errors first or by Last updated date. This is especially useful when you have lots of feeds and you might want to see those with issues first.
The Source Data section
The IR platform allows you to set up as many source feeds as you need to try to build the best master data set with the most complete product attributes. You may have a core product export from your ecommerce platform, pulled in by the IR platform plugin. Then a stock and price file being updated from your ERP pushed to our SFTP, updating every 15mins along with some additonal secondary feeds with perhaps some margin and best seller info. You will see all of these source files as a seperate tile on the Data Visualiser.
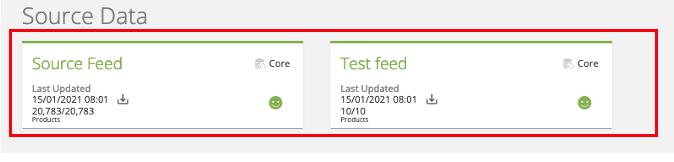
- Name and type of source feed file
- Last update time with freshness icon (green smiley is good, red grumpy is yes you guessed it - bad! 😀)
- Number of products when it last updated
TIP: Click on any of the tiles to open that feed in the Product viewer
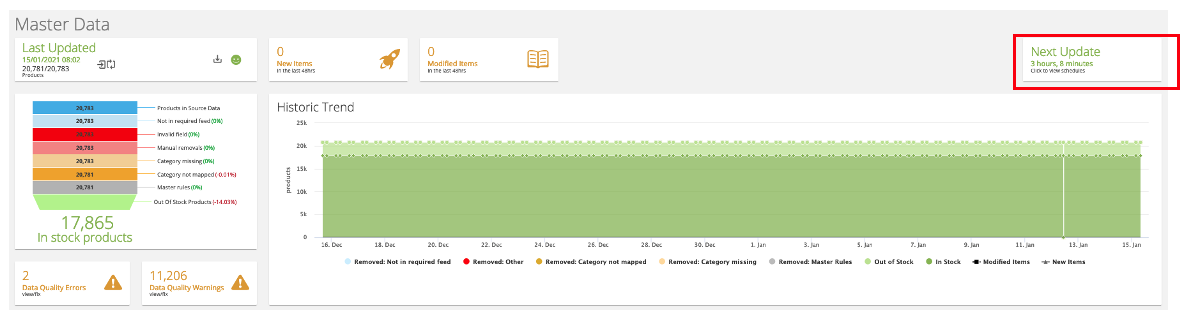
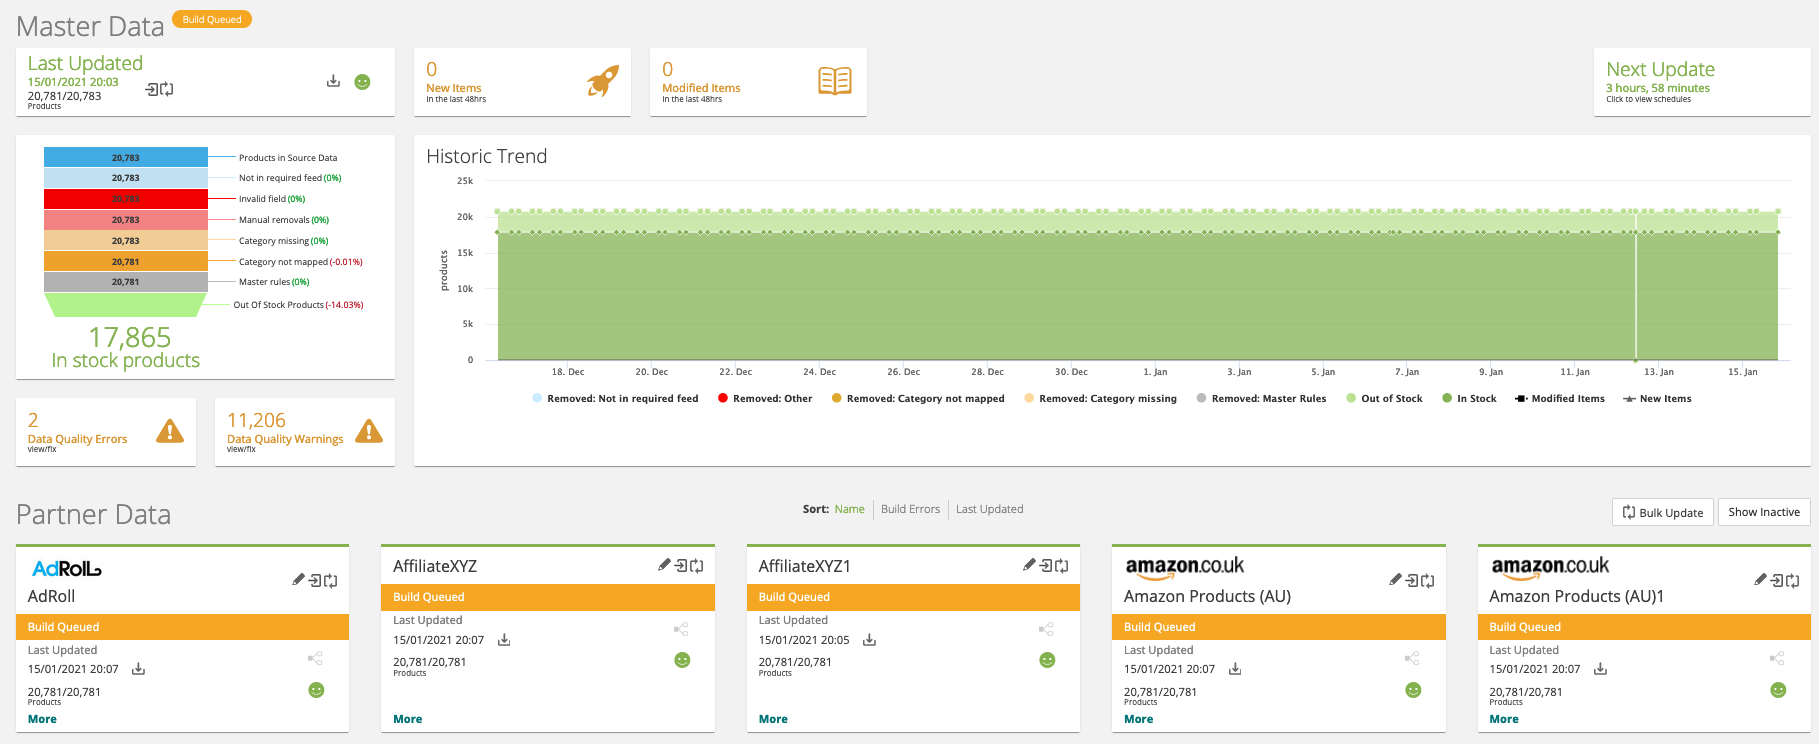
Master Data View
The Master Data is where the platform combines and optimises the data which is core to your account on the IR platform. This process effectively standardises as much of the data (both columns and attribute values) as possible, ensuring it can be quickly transformed into data for any partner requirements.It also allows us to score and analyse the quality of the product data.
The process of standardising requires the source data fields to be mapped to the IR master data fields, it also requires the source category values to be mapped to the IR taxonomy or category tree. This is set up/managed in the Master Feed Wizard. Once the initial mapping is done, the master feed will build to your schedule.
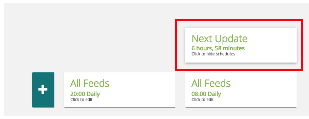
You will see when the next scheduled update will run

Setting up your data build schedules
To set up or manage your schedules you need to click on the Next update button on the right,
this will then open in line showing you any that have been set up or allowing you to add up to 4 update schedules.
For more details how to manage and set up see our KB Article on Update Schedules
When your feeds are building you will see messages across the platform and specifically the data visualiser from the activity stream showing "Build Queued"
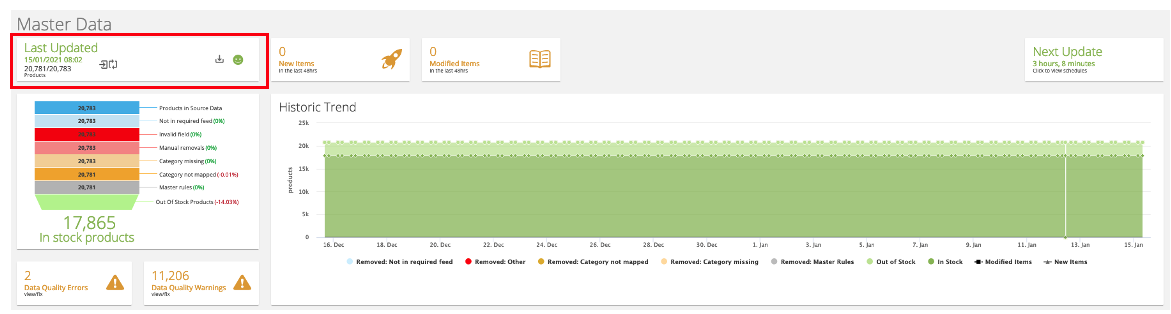
Last update information summary
You can see the last update time, exactly the same as the source data in the first tile.
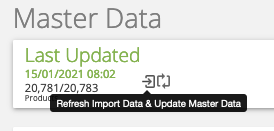
Manually update your Master data
You can run a manual update of your Master data using the update icons, the first option repulls all of your source data then rebuilds you master data, the second one will just rebuild your master data based on what is currently in the system.
The product funnel shows how the products move through from source to master, and shows where products are not being imported or have issues which will stop them coming into the IR platform and thus going out to partner channels.
Tip: Clicking on the category not mapped part of the funnel takes you to the category mapping screen.
The Product history chart shows the last 30 days of the breakdown of the funnel sections.
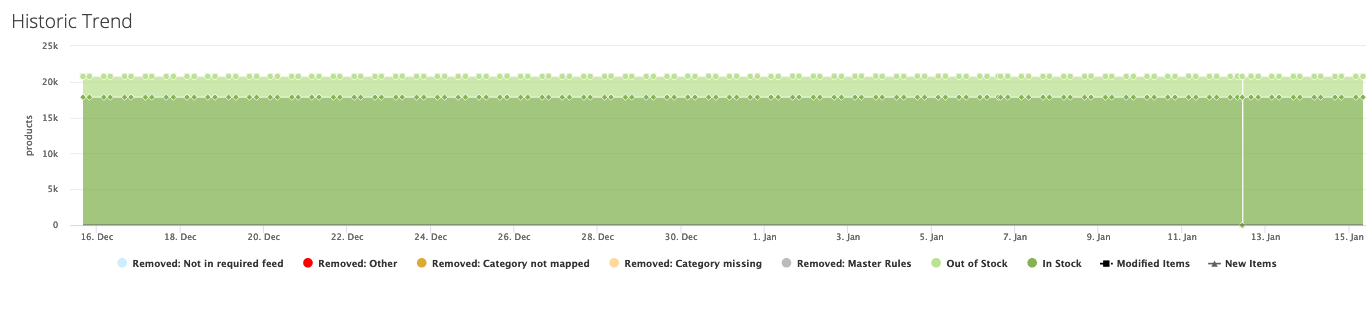
Right now the modified items or new items lines are small scale wise if you click on any of the legend it will remove those categories. So you will then be left with new or modified and the scale will auto update. (there is a user story to fix this 😀)
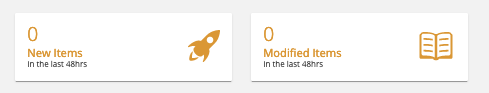
Quickly see new or modified products in the Last 24 hours
You can quickly see how many new and modified products you have had in the last 48 hours, and if you have not had any the tiles will be orange to warn you as it could indicate that your source data is being imported but the actual product data being updated on your side is stale and needs looking at by your IT team.
Identify Data Quality issues which need to be fixed
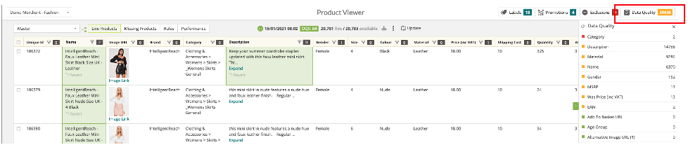
You will be shown details of any data quality errors, which you need to fix or any data quality warnings that you should fix.
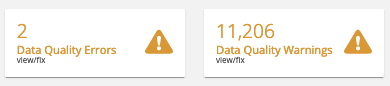
Click on these to open the product viewer, then click on the Data Quality button on the top right, the DQ analysis slider will then open allowing you to run through the issues and fix.
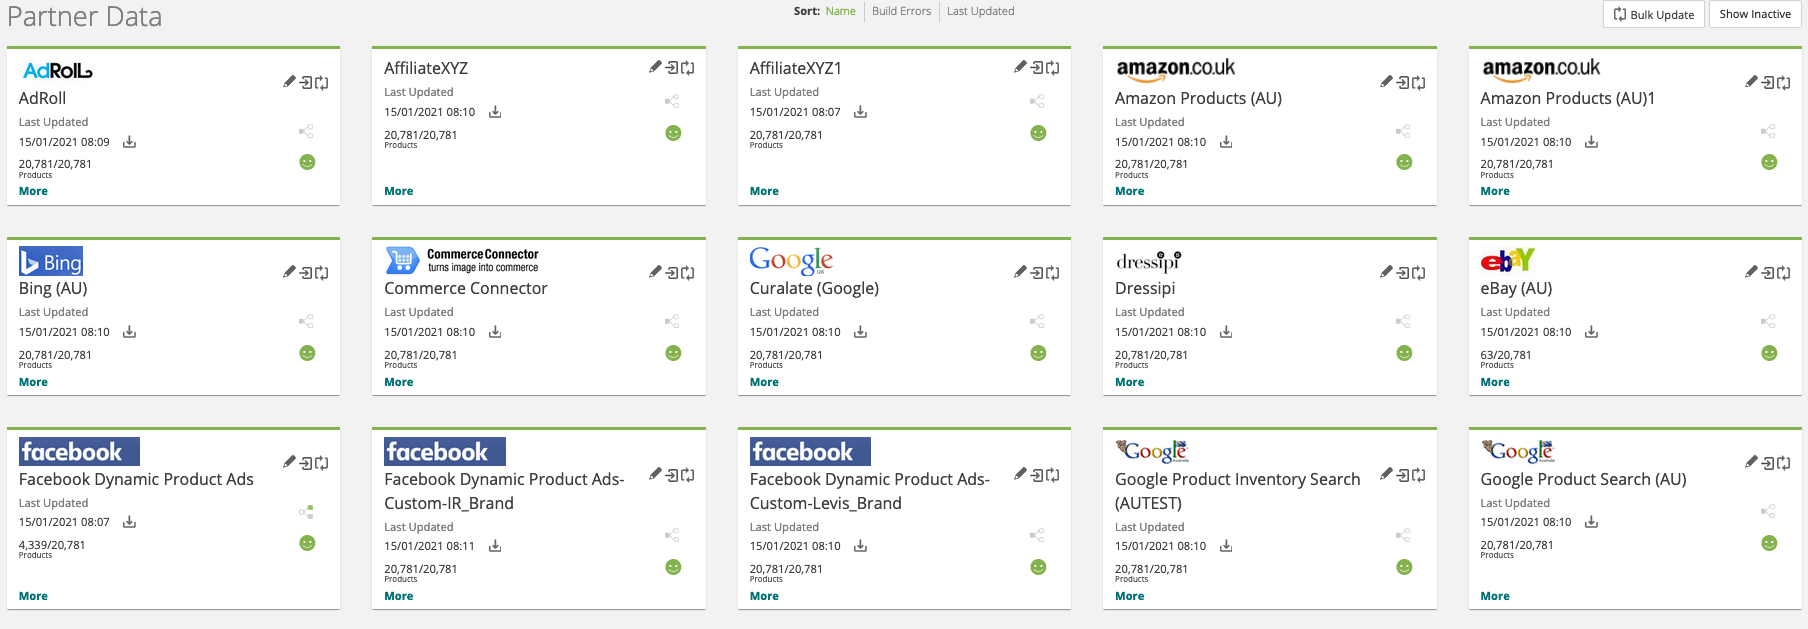
Partner Data Section
Here you can see all of the active partners you have set up on the platform.
You can change how the display just like the source. Green smiley faces and a green edged tile is good news 😀, it means their are no errors and the feeds are built and the data is fresh!
TIP: If, like lots of our customers, you have lots of partners it's best to use the search at the top of the data visualiser page.
- You can see the same update info, last build date/time, products which were available at the master level and how many were sent to the partner.
- You see at what level the feed is grouped or if the product is going out at full variant level , when you hover over the grouping icon
 it will tell you 😀
 - You can update the feed using the update icons
 like at the master level, you can also use the
  button at the top to update all partners in one go.
 - You can download the feed

- Click anywhere on the partner tile to open the feed on the product viewer
- Click the edit icon
 to manage the partner set up on the Partner Feed Wizard, you can also deactivate a partner if you no longer need them to receive data (use the
  toggle to find them again if you need to reactivate)
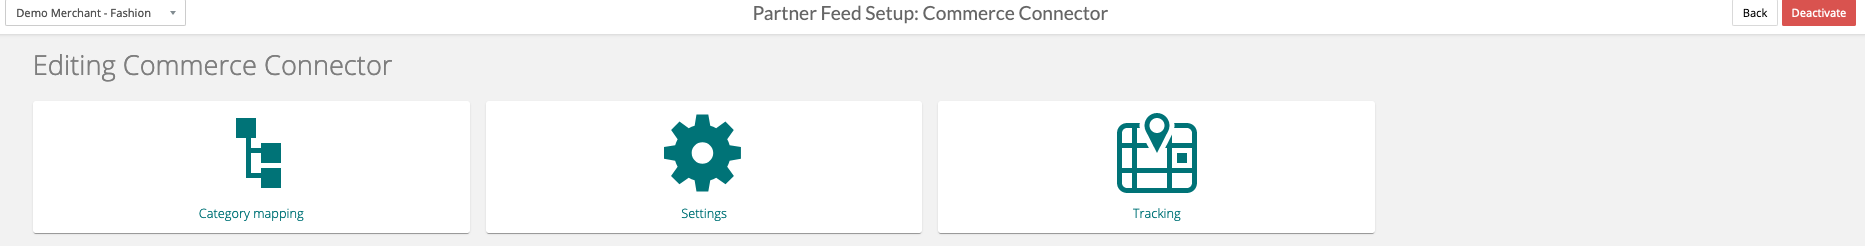
Visit our Managing your Partners using the PFW article for more information