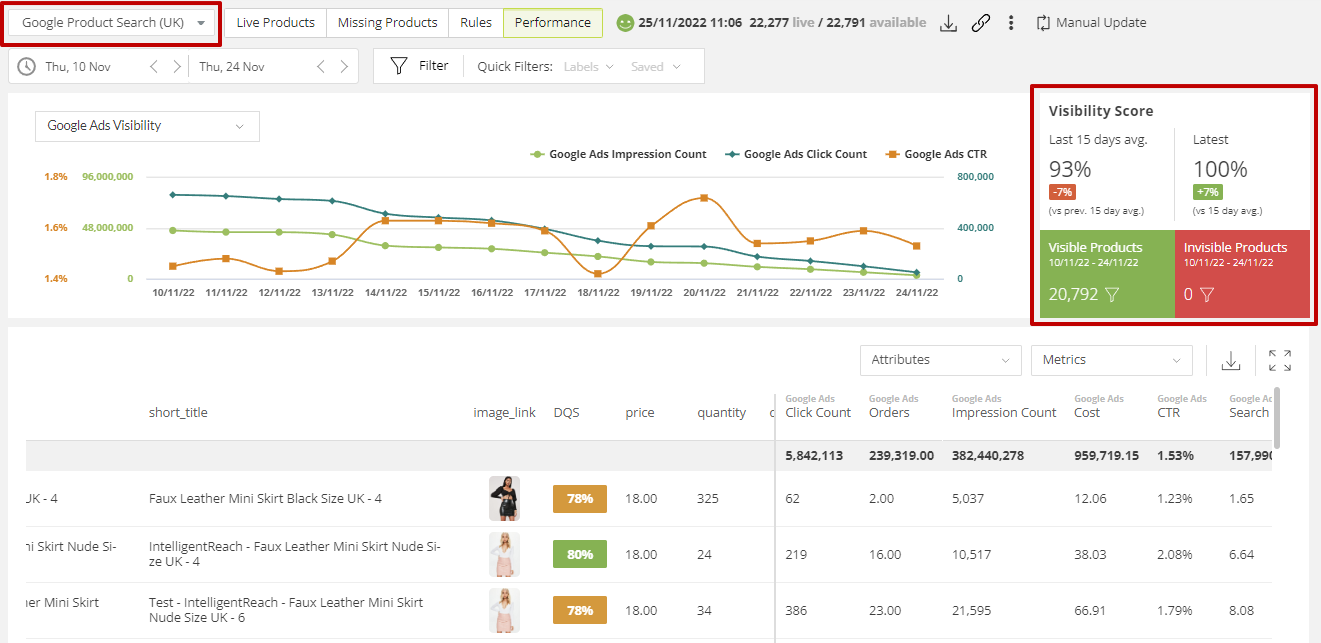
The Visibility Score feature is a core metric which assists in highlighting data issues and/or optimisation opportunities. Opportunities that are fundamental to any digital marketeer who strives to improve their data performance.
In a Google Product Feed, within the Performance UI you'll now have access to a Visibility Score window. 
WHAT IT'S USED FOR
The Visibility Score shows how your products have performed in two ways:
- the average score for the Partners set timeframe (in this example 15 days) vs the previous timeframe before that
- and the latest (last 24 hour period) vs the set timeframe
.png?width=688&height=446&name=image%20(2).png)
In the example below, the visibility score is indicative of a downward trend in the number of products that are receiving impressions every day during the last 90 days.

The above graph shows a downward trend in the Impression count

The above graph shows a downward trend in the products that are visible

The above graph shows a downward trend in order count, Revenue and ROAS.
