What is baseline reporting in Experiments and what does it mean for me?
As part of our drive to constantly bring innovation to the Intelligent Reach Platform, we have introduced new and more advanced reporting methodology for our Beta Experiment customers.
You will see these new stats available for all A/B experiments (past and present) when you navigate to the Experiments module: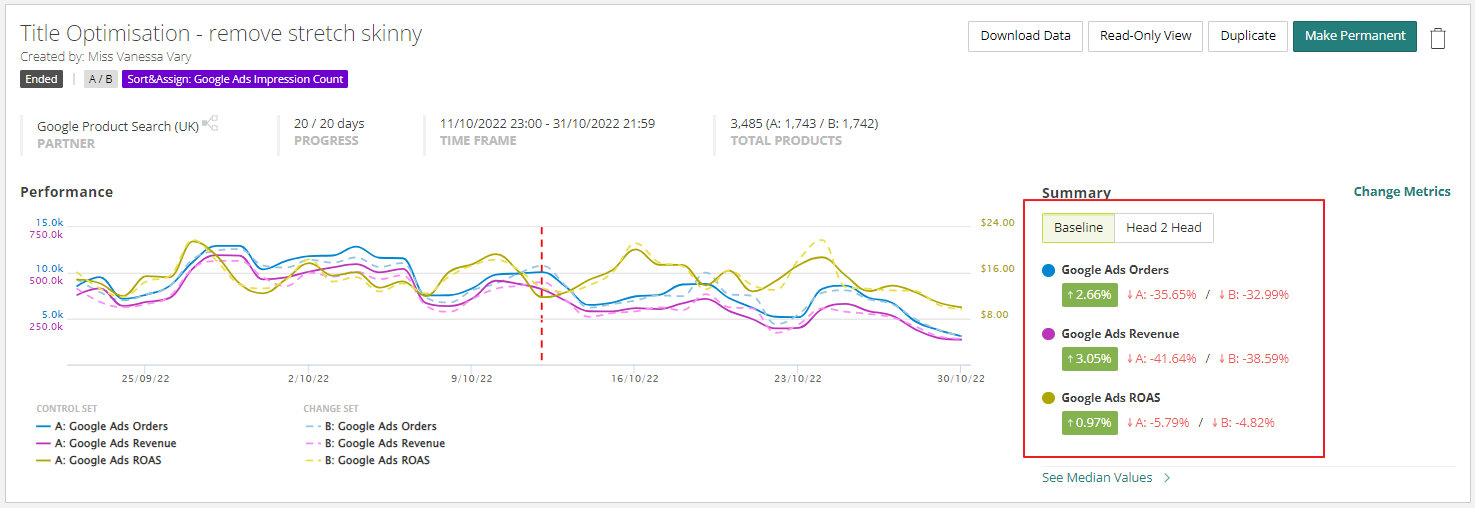
What is 'Baseline' reporting and how does it differ from 'Head 2 Head'?
Baseline is a methodology that is available to A/B Experiments because there is a control group present. It analyses the underlying performance of the control group throughout the duration of the experiment, to quantify and therefore remove the influence of external factors (such as seasonality, promotions etc) on the overall performance of the experiment.
It does this by directly comparing the relative increase within both Set A and Set B. The variance between those two uplifts is then reported as the impact of the experiment.
This differs from the Head 2 Head methodology which is a direct comparison of Set A vs Set B and does not take into account natural fluctuation in overall performance.
How to interpret Baseline results?
If we take the following Baseline statistics as an example: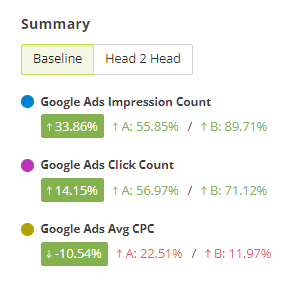
The Platform is reporting that our Google Ads Impressions in Set B (our change group) performed 33.86% better than Set A (our control group). This is calculated by looking at the relative change in performance of both Sets.
Set A increased by 55.85% despite being the control group with no changes made - This is the natural influence of factors outside of the controls of the experiment.
Set B increased by 89.71%, but it would not be fair to state that our experiment drove an 89% uplift, as we already know that naturally, the products in our control group performed 55% better when no changes were made.
The actual impact of the experiment is therefore the difference between these two figures - 33.86%.
If we then look at the comparable statistics from the 'Head 2 Head' methodology for the same experiment, these would have been: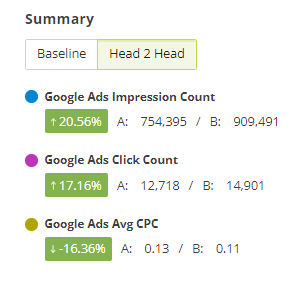
Where the stats above are a direct comparison of only Set A vs Set B during the experiment time frame. This does not include the allowance for the natural change in performance.
Does this mean Head 2 Head results are incorrect?
The short answer here is, no. It does not mean that the Head 2 Head methodology is wrong. We just have to make sure that we are using the correct analytical model for the type of experiment we are running and that we understand the impact of each. Ideally, we should review both models.
If our experiment is for example deployed as an MVT (multi-variate) experiment where we have 2 changes live at the same time, then we don't have any control group in consideration.
In this instance, we might choose to take the 'Head 2 Head' methodology as our leading analytical model as we're asking which of our 2 changes performed best during the experiment.
That doesn't mean we discount the Baseline stats entirely, though. What if Set B performed better than Set A, but both sets performed worse overall than the Product data before any changes were made? We would still rely on Baseline to highlight this.
Why are some uplifts Good (green) and others Bad (red)?
Put simply, this just depends on whether an increase in the chosen metric is a good or a bad thing. If we take the above Baseline example again:
Impressions in Set B increased by 89.71% - higher impressions = good thing
Clicks in Set B increased by 71.12% - higher clicks = good thing
Avg CPC in Set B increased by 11.97% - higher cpc = bad thing
However, Avg CPC in Set A increased by 22.51% so the overall net effect of the Experiment was still reported as a positive change of -10.54% (because lower cpc = good thing)